Reading the graph and stories
The graph
The main screen is a map of your project. Sources are on the left, staging models in the middle, and the models people use in reports on the right. Lines show which model reads from which.
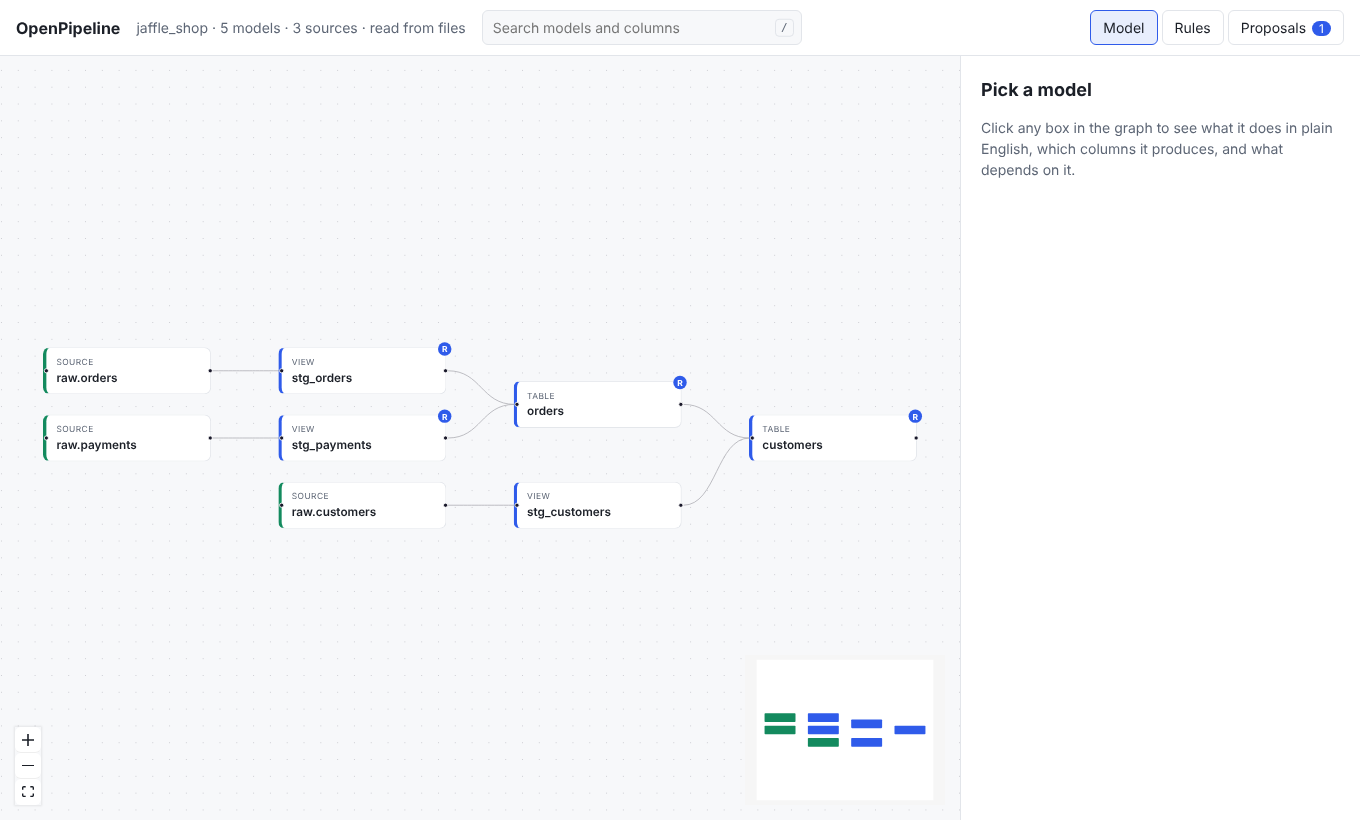
- Click a box to open that model in the side panel. The graph dims everything that is not connected to it, so you can see what it reads from and what depends on it.
- Drag and scroll to move around. The small map in the corner shows where you are.
- A small R badge on a box means the model carries a business rule.
- The top bar tells you how many models and sources were found, and whether they were read from the manifest or from your files.
If something could not be read, a yellow banner at the top lists the warnings.
The story
Select a model and the side panel tells its story.
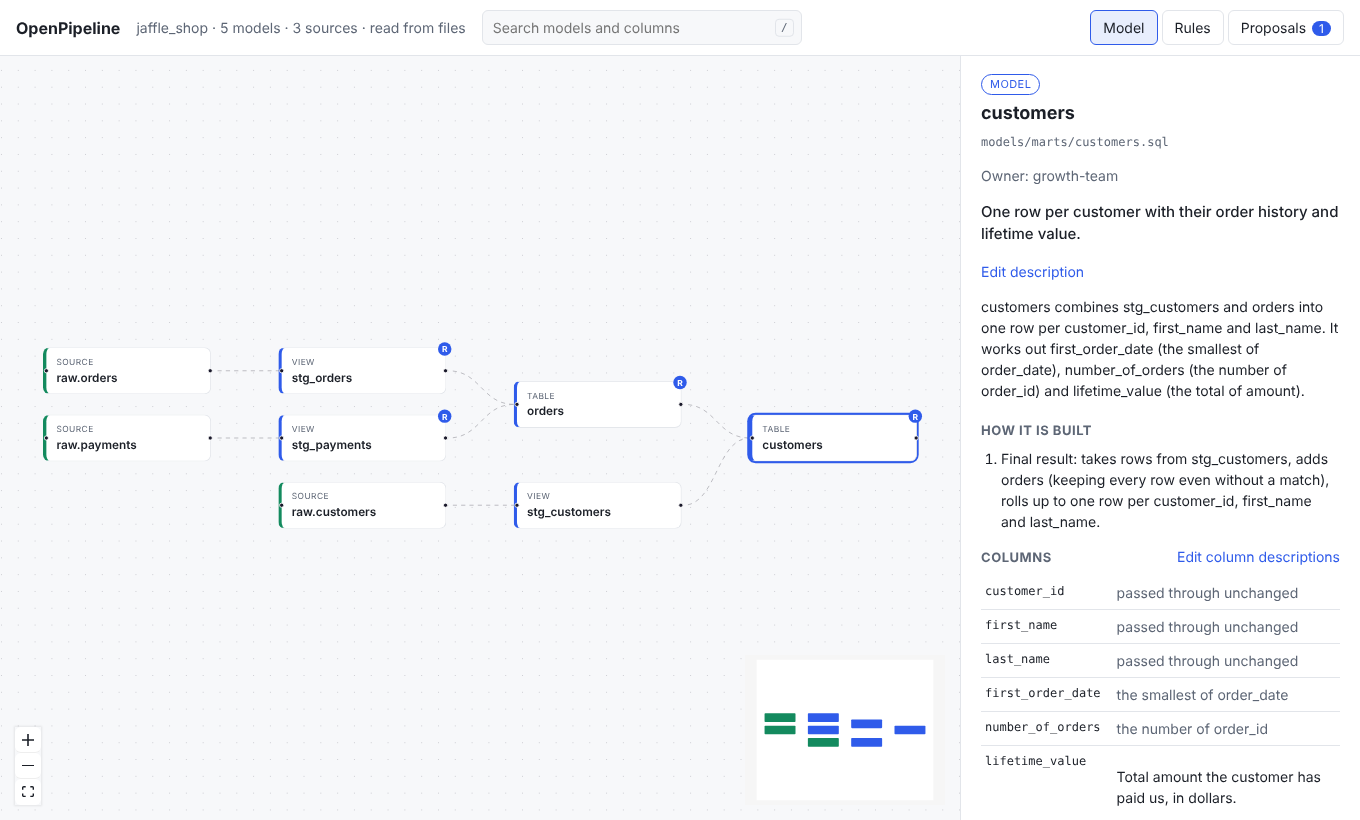
From top to bottom:
- Description. The text from your dbt YAML, if you wrote one. You can edit it right here.
- Explain with AI, if you turned it on.
- Summary. One paragraph that says what the model produces: its grain (one row per what), and what its main columns mean.
- How it is built. Numbered steps in plain words: where the data comes from, how tables are joined, what is filtered out, and how rows are rolled up.
- Columns. For each column, your description and how it is worked out
("the total of amount per order_id", "passed through from stg_orders"), and
the step (CTE) where it was worked out. Columns are followed through CTEs and
select *, so you see the real column names, not*. - Business rules. The business rules the model carries.
- Column lineage and Sample rows. See Search and column lineage and Sample rows.
- If this changes, these are affected. The models downstream of it.
The story is built from the structure of the SQL. It is instant, free, and private, because nothing is sent anywhere. For a more natural write-up, you can turn on AI explanations as an extra.
Run dbt compile for better stories. When the manifest has dbt's compiled SQL,
OpenPipeline reads that instead of your files. Macros, var() and if blocks are
already resolved there, so a column built with {{ cents_to_dollars('subtotal') }}
is described as "subtotal divided by 100, as a number". Without compiled SQL it
falls back to your files and shows macros by name ("the cents_to_dollars macro
applied to subtotal"). The same SQL feeds column lineage.
On the command line
openpipeline explain customers            # the story, in the terminal
openpipeline explain customers --json     # the same, as JSON
openpipeline graph                        # the whole graph, as JSON
Limits to know about
- When OpenPipeline reads plain files, it understands
ref(),source(), andconfig(). Macro calls are shown by name, only the first branch of an{% if %}is read, and aforloop body is read once. Rundbt compileto use the manifest and its compiled SQL instead. See the FAQ. - A story describes what the SQL does. It cannot know why. Add the why to the description, or name it as a business rule.